Third Year’s tracking of Hybrid Garage use.

So, it’s been three years since I’ve started tracking our garage’s EV vs ICE use.

As I previously wrote (three years ago on my Minimizing Gas Use article; on my update two years ago; and the one from last year) we drive a hybrid garage.

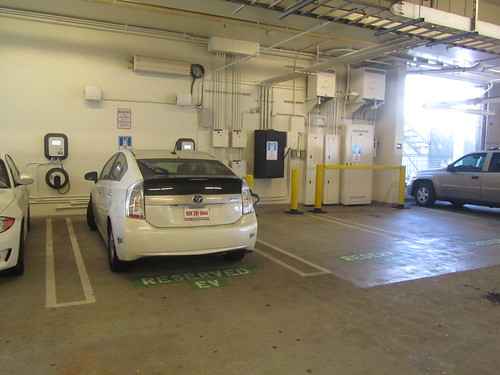
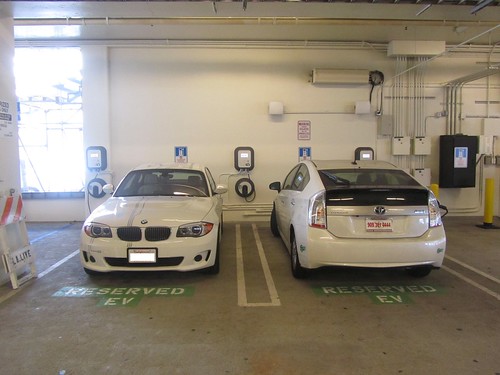
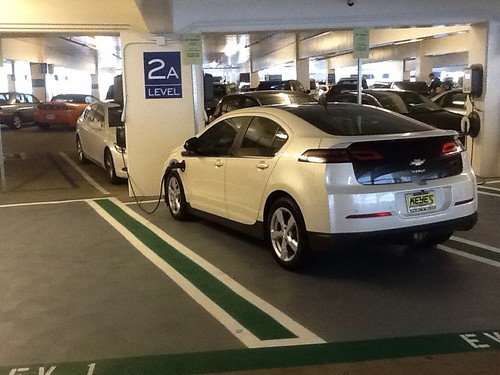
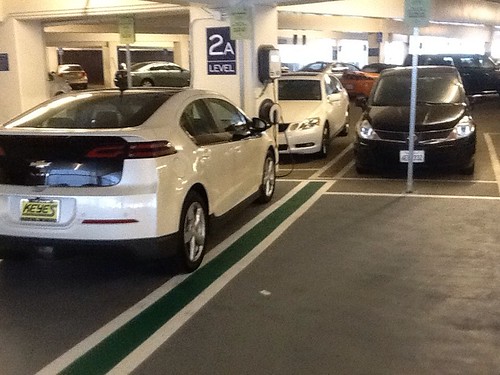
For those that need a refresher, a hybrid garage is one where some of our cars are EVs and the others are internal combustion engine (ICE) cars. As a family that is a part of the rEVolution, why do we still have ICE cars, it’s because we’re not as good as those that have gone to an all electric lifestyle. Hats off to them, but there are just times that I like to use vehicles that happen to use gasoline.

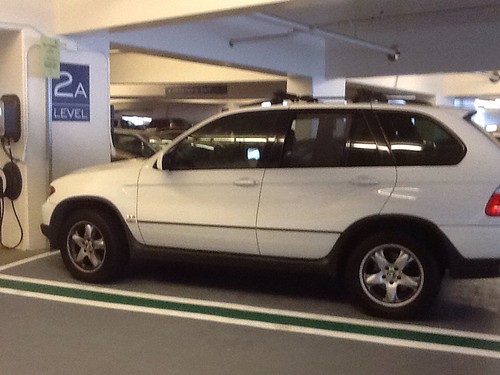
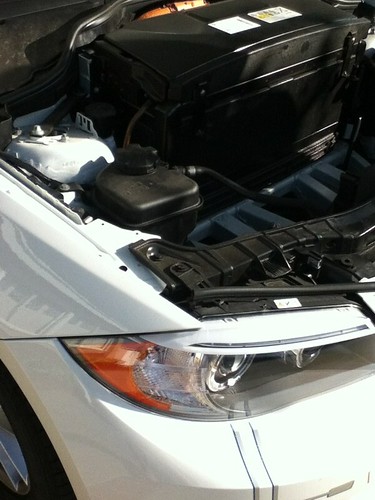
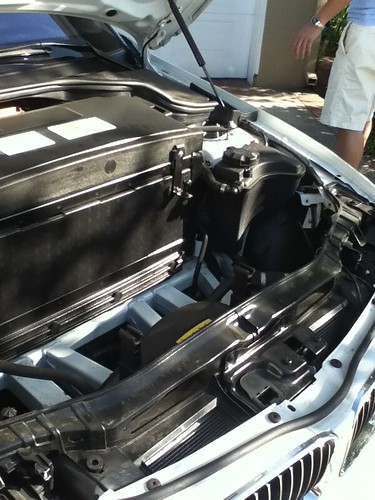
This winter” was supposed to be better than any of the previous “winters”, but we did not brave the mountains with our fifteen year old BMW X5. The X5 lets us go to the mountains around LA when there are restrictions to drive when the snow is fresh.  Additionally, when we need to buy large items to move, we’ll use this same workhorse to help us move them.  Granted the Model S does have a LOT of space, but we prefer to beat up the X5 with hauling stuff rather than put the Model S to work.

That being said, I understand the costs of our addiction to oil and gas and we continue to try to minimize our gasoline use.

In preparing for the last article on Celebrating Four Mostly Electric Years, I noticed that I had transposed some statistics and noticed that I had overstated the EV miles by 36,000 miles, so I wanted to make sure to correct that.

Three years ago, I started tracking the number of miles my household used ICE vs. EV to see what percentage of our private car travels are electric and what part are powered by internal combustion engines.  Our methodology was to count the miles driven in rental cars to this spreadsheet and the miles that we’ve lent our ICE vehicles (and EVs) to our friends and family when they visit Southern California.   This is why I created some tracking spreadsheets and tracked mileage for a year.   The results year over year are still impressive even with the mileage transposition error in year 2.

In the first year of the study, we drove EV a total of 81.20% of the time and ICE 18.80% of the time.

In the second year of the study, we drove EV a total of 92.64% (vs. what I thought was 94.78%) of the time and ICE 7.36% (vs. what I thought was 5.22%) of the time.

As a whole, the household (as defined earlier, my wife and I and when we lend the cars to family and friends) drove about 46,000 total miles (both EV and ICE in the previous period) in the first year, about 40,000 miles in the second year, and we drove a total of approximately 41,000 total miles in this third year. That’s approximately the same number of total miles between years one and year two.  Even though a good number of those miles were the 8,245 miles of coast-to-coast driving from our Here, There, and EVerywhere trip in May 2015.

Because of the error in Year Two’s calculation, I thought that we would be close to 150,000 EV miles this year, but still at 126,000 All EV miles since we started driving EVs.  For the study, we’re closer to 112,000 EV miles and 14,000 ICE miles for a study average of 88.7% EV vs 11.3% ICE three year average.  Definitely an upward momentum.

Looking at the monthly figures, for the third year shows a big blip in the ICE use for month 34 and that is mostly December 2015 and my sister and her husband was visiting us and most of those miles on the X5 was because we had lent them our ICE car for that month.  The approximately 1400 miles of ICE that was driven that month is more than half the total ICE miles for the year.  Until we have an EV to lend out to family, we’ll have to take those spikes.

Here’s to hoping that this next year’s study will have a greater EV momentum.  And we continue to look forward to seeing what else we can achieve with our hybrid garage next year.  Perhaps another coast-to-coast EV journey.

Second Year’s tracking of Hybrid Garage use.

So, it’s been two years since I’ve started tracking our garage’s EV vs ICE use. As I previously wrote two years ago on my Minimizing Gas Use article and on my update a year ago, I do drive a hybrid garage. For those that need a refresher, a hybrid garage is one where some of my cars are EVs and the others are internal combustion engine (ICE) cars. As a family that is a part of the rEVolution, why do we still have ICE cars, it’s because we’re not as good as those that have gone to an all electric lifestyle. Hats off to them, but there are just times that I like to use our vehicles that happen to use gasoline.

This past “winter” was better than last year’s “winter”, but we did not brave the mountains with our fourteen year old BMW X5. The X5 lets us go to the mountains around LA when there are restrictions to drive when the snow is fresh.  Additionally, when we need to buy large items to move, we’ll use this same workhorse to help us move them.  Granted the Model S does have a LOT of space, but I’m not one of those brave souls to carry “cargo” in them.

Last year we also had our BMW 328iC Convertible. But we sold that now that we’re more comfortable removing and re-installing the roof on the Tesla Roadster. So, on those days that we feel like driving around Sunny Southern California with the top down, we just use the Roadster.

That being said, I understand the costs of our addiction to oil and gas and we try to minimize it.

Two years ago, I started tracking the number of miles my household used ICE vs. EV to see what percentage of our private car travels are electric and what part are powered by internal combustion engines.  Since we travel a little bit, I’ve decided to count the miles driven in rental cars to this spreadsheet and the miles that we’ve lent our ICE vehicles (and EVs) (ICE is now singular over the course of the second year of this study) to our friends and family when they visit Southern California.   This is why I created some tracking spreadsheets and tracked mileage for a year.   However, the results from last year to this year are impressive.

In the first year of the study, we drove EV a total of 81.20% of the time and ICE 18.80% of the time.

In the second year of the study, we drove EV a total of 92.64% of the time and ICE 7.36% of the time. 94.78% of the time and ICE 5.22% of the time. [Correction from 3/10/2016, discovered transposed number in tracking miles a year later.] We sold our second ICE car in Month 4 of the second year (or 16th Month overall). Additionally, we did try to rent EVs on trips as much as possible, unfortunately, even in areas of the country that have EVs available to rent, the vehicles were rented out ahead of the time of our trip there (specifically Honolulu and Orlando). We tried to rent an EV on a trip to Portland, however, at the time, there was no onsite EV rental at PDX International Airport.

As a whole, the household (as defined earlier, my wife and I and when we lend the cars to family and friends) drove about 46,000 total miles (both EV and ICE in the previous period) and we drove a total of approximately 39,300 55,000 total miles in the second year. That’s an increase of 9,000 decrease of 7,000 more miles of total driving of which 52,500  36,422 of those total miles were EV. That’s nearly 6,000 more miles than ALL the driving that we did during the first year of the hybrid garage study.

Interestingly, I did a quick 31,310 Tesla Model S update the day before the end of the second year of the study period and I had a lifetime Model S efficiency of 308 wH per mile. At the end of the day of the second year of the study, that average went down to a more efficient 307 wH per mile.

IMG_20150305_231354

Throughout the past year I’ve been using 308 wH per mile for my calculations. Now going to have to use 307 wH per mile. That achievement is something.

One of the things that I was hoping to announce in this post is, as a family, we’ve reached 100,000 all EV miles across all three EVs that we’ve leased or owned, but sadly at the end of the second year of the period, we’ve been able to get to 99,665 miles on all the EVs that we’ve owned or leased. Now if we were to count our loaners and the few times we’ve been able to rent EVs in this count, I’m sure we’re well over 100,000.

Looking forward to seeing what else we can achieve with our hybrid garage next year.

Mea culpa… I drove ICE today…

Living with a hybrid garage and running in the high 90s in percentage so far this second year of tracking our EV vs ICE usage I have to constantly remind myself to use an ICE car.

More often than not, these trips are for really short distance errands and every now and then it is for longer trips. Trips such as going to the airport and parking at an outdoor lot, exposing the car to the elements and jet-fuel. Things that I would not dare expose my EVs to.

So, on my last trip out of town, we decided to drive the soon to be sold (getting it ready to be in that “condition”) BMW 328iC to the airport for “parking duty”. It was an uneventful drive with the car and it performed admirably in its duty to sit there and wait for us to arrive. However, on the day of our arrival, as I was heading home to swap out the car for the Model S, the check engine soon light turned yellow. I called my BMW Service Advisor to let him know what has transpired and to get a quote on what it could be and what it could cost to repair. I figure if I knew what the amount was, I can lower my ask to accommodate whoever purchased the vehicle when I sold it within the next month and change. Since the car wasn’t driven much and I’ve had a great rapport with my advisor over the past decade of BMW ICE driving, he said to give him a chance to see if it is something that can be covered from the last service (i.e. perhaps it was something they missed and can get covered gratis.)

So, today, I drove ICE to get the car checked out and properly ready for “listing for sale duty.”

In the meantime, the weather in Southern California cooperated. I have a tolerance between a sunny 67 degrees Fahrenheit and 73 degrees Fahrenheit for when I take the top down in this car (yes, I am a Southern Californian AND very spoiled in what determines convertible weather for me.) So, one of the things that ICE cars currently do better than EVs is convertible driving. That may seem like a funny statement, but production EVs that are convertibles are pretty much limited. The Roadster is great, but to take the top down is a manual process and the roof needs to be stored when the hardtop is removed. The Smart ED convertible has a roof that rolls back into the car, but it’s a ragtop and the car itself has no power. Now, there have been rumors of a conversion for the Model S, but that makes an expensive car, even more expensive with an unsupported drastic modification.

IMG_20140508_104237

Convertible weather for me is always a combination of sunny and a little cool, so the weather cooperated:

IMG_20140508_105449

or for those of my readers that experience weather in Metric:

IMG_20140508_105514

I had expectations of the drive being less smooth because of the gears and the like, but the Check Engine Soon Light portends to a repair cost that I hope to be somewhat uneventful, but I’m not holding my breath. The car does seem to be more sluggish than usual.

At least, I’m still rolling in top-down, convertible style.

First Year’s Tracking of Hybrid Garage use.

So, it’s been over a year since I’ve started tracking my garage’s EV vs ICE use. As I previously wrote a year ago on my Minimizing Gas Use article, I do drive a hybrid garage. For those that need a refresher, a hybrid garage is one where some of my cars are EVs and the others are internal combustion engine (ICE) cars. As a member of the rEVolution, why do I still have ICE cars, it’s because I’m not as good as those that have gone to an all electric lifestyle. Hats off to them, but there are just times that I like to use my vehicles that happen to use gasoline.

This past “winter” was not indicative of what we usually use our thirteen year old BMW X5 for, but when it snows, it’s fun to go up to the mountains around LA and play in the snow.  The X5 lets us do that when there are restrictions to get up the mountain when the snow is fresh.  Additionally, when we need to buy large items to move, we’ll use this same workhorse to help us move them.  Granted the Model S does have a LOT of space, but I’m not one of those brave souls to carry “cargo” in them.

Prior to adding the Roadster to the garage, we kept the 328i Convertible for those days that we wanted to drive around with the top down.  We still have it and waiting for the start of summer to sell the vehicle when we expect to have the best demand for them.  (Send me a note around May if you’re interested in buying our 2008 328i Convertible).  Granted the BMW Convertible is a lot easier to take the top down and up on than the Roadster, this will probably be the next ICE to be sold from our garage.

That being said, I understand the costs of my addiction to oil and gas and try to minimize it.

So, about a year ago, I started tracking the number of miles my household used ICE vs. EV to see what percentage of our private car travels are electric and what part are powered by internal combustion engines.  Since we travel a little bit, I’ve decided to count the miles driven in rental cars to this spreadsheet and the miles that we’ve lent our ICE vehicles (and EV) to our friends and family when they visit Southern California.   This is why I created some tracking spreadsheets and tracked mileage for a year.   However, the results were stupefying.  After 365 days of meticulously tracking the mileage consumed by my household for EV vs. ICE for the year, the old 80/20 rule asserted itself with up to two decimal points of the percentages.

We drove a total of 80.05% of the time and ICE 19.95% of the time.  Granted, this sample for the past year included three EVs from November 2013 to March 2014 as well as several long-term (a week or greater) visits from family and friends who we lent our vehicles to.  Furthermore, a majority of this past year’s sample was with the Active E as the only EV in the garage, and as a result we were only constrained by the 80-100 miles of range per charge.  With the Model S and Roadster, our range is at least double that (if not more) as we have ample access to really fast recharge rates with the Model S.

It is interesting to note that the majority of more EV mile percentages for the months occurred in the latter part of the year, when we had taken delivery of our two Teslas.  More importantly where both my wife and I had both driven predominantly EVs for our daily drive.  Whereas in the earlier part of the year, we only had the Active E and one of the ICE vehicles ended up being the other car driven.  As a whole, the household (as defined earlier) drove about 42,000 total miles.

Since, I’m an EV Geek.  I’m wondering what the next year will bring since we’ve given up our Active E and are both driving Teslas that give us at least 170 miles of range on a full charge.  I would hasten to guess that the percentage of EV use vs. ICE use should dramatically increase, but another year will let us know.  In the meantime, bask in the mediocrity of the past year.  [80/20, what a let-down.  Or should I really just celebrate verifying one of those rubrics that we’ve been taught since youth.]

[UPDATE 2014-06-15]Well, I guess I was NOT using my spreadsheet properly, I actually did not have an 80/20 first year, it was closer to 81/19… (or exactly 81.20% vs. 18.80%) It would seem that I forgot to calculate in the LAST month, fixed the calculations and it’s now correct.

More Napkin math, OR – Real Goods Solar and BMW’s program is a REAL GOOD deal!

Saving money while saving the environment is an addictive process.  It’s crack for good Karma!  I feel like Michael Corleone in the Godfather III, I try to get away from it, but they keep dragging me back in!

As I had indicated on my Ping! post, I got “unofficial” Permission to Operate (PTO) on August 17, 2012 and finally received official PTO ten days later on August 27, 2012.

So, we’re now running our car on Solar Power…  or are we?  Unless your house is completely disconnected from the electric grid, what you are really doing is netting out generated power from the solar panels on the roof with consumed power from the electric grid.  So, if you’re overproducing power from your solar panels than what you’re consuming, you get money back, otherwise you’re really just netting out what you’ve made with what you’ve used.  As I have published previously, the rate to charge depends a lot on what tariff you’ve chosen.

In my first napkin math post, I charged on the SCE Domestic rate which effectively got me charged at $0.31 per kWh as my usage of electricity had already pushed me to Tier 5 for most of the billing periods.  In order to normalize and compare ICE vs Electric, I calculated that the cost under the first plan was 1.714¢ per mile

By my third napkin math post, I attempt to alleviate that $0.31 per kWh charge by opting for the whole house SCE Electric TOU Tiered rate structure, this pretty much reduced my rate to charge to $0.13 per kWh for my car charging needs (as well as my pool pump as I switched the time of use for that from mid-day to mid-night to 6 am).  As we noted on that post, my cost per mile dropped to about 1.412¢ per mile.

So, the big question is what is my cost per mile under the Real Goods Solar and BMW ActiveE program deal.

IMG_1598

Before I took advantage of this deal, I would like to tell you about my search to save our energy costs further.  Not necessarily the environment, but that’s always a fun side-effect with this accidental environmentalism that I’ve stumbled across.  After signing up for the Active E, I figured to become educated on what my solar options were.  To that end I requested quotes from three solar companies in the Los Angeles County area: Peak Power Solutions (Sunpower reseller), Solar City, and Verengo Solar.  Each solution had its strengths and weaknesses and around the third week of March (between three to four weeks of receiving my ActiveE), I decided to sign a power purchase agreement with Solar City.

A power purchase agreement is basically the right to buy a guaranteed amount of power from a provider for twenty years.  I don’t own the solar array on my roof, someone else does (a finance company) and I agree to pay them a fee for this.  This means at the end of twenty years I get the option to keep buying from them, buy the equipment outright, or have them remove the array from my roof.

So, how did I compare the suppliers.  Ultimately, economics.  So, at the end the Solar City deal that I had originally signed was approximately $0.10344 per kWh.  How did I calculate this?  All the suppliers with the power purchase agreements have a guaranteed rate of production for the 20 years that the system will be produced, so I divided the total guaranteed kWh by the the total prepaid lease amount, and that’s how I got to the $0.10344 per kWh.

So, I thought that was it.  I signed up with Solar City, got a rate that I felt was fair and waited to get installed.  Solar City’s installation process was methodological and professional.  They provided a website to track the progress of the installation and was quite impressive.  However, their process proved to be the opportunity for Real Goods Solar and BMW’s deal to come in and make my costs even less.  Around the beginning of May, during the design and survey process, Solar City notified me that in order to proceed with the installation of the system that I signed in the third week of March (about five to six weeks earlier) my roof would have to be replaced.  This change provided me with an out-clause from completing the agreement that I signed with Solar City.

As I was mulling through a roof quote and setting up more roofers to see what this replacement roof would cost me, Real Goods Solar and the BMW Active E program announced their program.  So, I figured, why not ask them to see what the solution would cost me.  I contacted Real Goods and they had a sales agent contact me within the day.  Their initial quote was 12% less than the Solar City quote and agreement that I went with.  However, I had to bundle in the cost of the replacement roof and needed to get the total project cost to figure out which deal I was going to take.

Figuring that both solar companies would probably be able to get a reliable, professional, licensed roofer at a lower cost than I would have on my own, I went back to both providers to find out what the roof was going to cost from them and go from there.  My assumption was not exactly correct as my independent roofer quote was actually $500 to $1000 cheaper than the lowest quote from either solar provider.  I was at an inflection point.  I was already saving quite a bit on gasoline with the TOU tariff and this would have been the time to quit or cut bait.  I approached both providers to see if there was anything they can do to their quote to make the entire project less expensive (replacement roof and solar).

The dilemma is how do I adequately calculate my cost per kWh based on the various scenarios.  I figured the most conservative thing to do would be to subtract the lowest roofing quote from my total project cost and use that figure to divide my cost per kWh over the guaranteed generation over the life of the system.  Granted, this methodology would provide me with an understatement of cost as the guaranteed rate of production is typically rather conservative of the suppliers, but it IS what they guarantee, that is why I went with that methodology.  When the system has really sunny days it will outperform this guarantee and my actual cost per kWh is less than what I calculated.

With the total system cost, I figure that my cost per kWh is $0.10250, however, if I subtract the roof cost my cost per kWh drops to $0.07970 based on guaranteed power.  Seeing that my energy cost is a 38.7% reduction, mathematically speaking, my cost per mile is approximately .8657¢ per mile ($0.008657) or 73.58 cents per day based on the 85 mile day that I had in the last post on this matter.  Not bad at all.  Of course, the system is currently overproducing and with time of use I actually am paid a rate for the energy I am sending back to the grid during the day and most of my charging occurs between midnight and 6 am, so this is, like my other estimates “napkin math”, so I am certain my actual costs are lower, but the numbers work for me.  Remember, my original calculation of a comparable vehicle costs were approximately 17 cents per mile, so my 0.8657 cents per mile cost is quite a bit less than driving my ICE 328i convertible.

So, there you have it.  My energy costs are a heck of a lot less than it has been.

Want to see what my system is producing, check out the sidebar production information courtesy of Ken Clifton‘s plugin for WordPress or directly from Enlighten’s website.

In a few days, I will follow up this Napkin Math article with pictures and my opinion on the installation from Real Goods.  Let me just say, I recommend them and if you give my name, I get a referral on your system, so contact me if you’re serious and I will recommend them.

Interested in going solar? Get a quote from my solar vendor – Real Goods Solar.

IMG_1602

Public Charging stations and being mindful of the parking situation

Currently, the biggest challenge with public charging stations is when an internal combustion engine car is taking up a charging spot so that an EV can not use it.  This is what is meant when an EV driver mentions that a spot is ICEd.

Most public charging locations try to solve this problem by properly marking up their spots AND in some locations actually ticketing violators of their signage.

See this BMW X5 at the Americana at Brand –

Americana at Brand - Level 2A - BMW X5 ICE spot (ticketed) - 1

and a close up of the ticket issued to the driver –

Americana at Brand - Level 2A - BMW X5 ICE spot (ticketed) - 3

I really appreciate centers and police departments that enforce these EV only spots as it hopefully actively deters the practice of ICEd locations.

This is an easy violation to spot.

The thing that I believe we need to come up with a solution for is the fellow EV driver that picks a charger that blocks out others from being able to use either the parking spots or other EV chargers at the location.  Let me attempt to explain this.  If you have a charging port on the opposite side of the car where the charging station is and a charging station that is on the same side of the car, some drivers will pick the one closest to their charging port, EVEN IF doing so will effectively make a spot or another charger unavailable for the next car to use.  I don’t know what to call this violation, but here are a few pictures:

At L.A. Live, Lot W (West Lot), I’ve seen this Plug-in Prius park in spot 2 while using the charger from spot 3 to charge with.

Untitled

I made this crude diagram to demonstrate the point.  The Os are the Blink EVSEs.

By using the charger in Spot 3 while parking in Spot 2, the plug in Prius effectively blocked out use of Spot 3 for MOST cars.

Here’s the same Prius doing the same thing at this location at another day –

IMG_3341

To solve this, and to allow others, should they arrive I moved from Spot 1 and parked in Spot 3 and used Spot 2’s EVSE to charge to allow Spot 1 and Spot 4 to charge, should some other EVs need to take the spot.

BEFORE
IMG_3340

AFTER
IMG_3342

However our cords were crossed during this time, and would’ve been a hazard. Mr. or Ms. Plug-In-Prius could’ve solved this by just taking Spot 4, and this is exactly the point I am trying to make.  Pay attention to how the spots are configured and ensure that the charger and spot you are taking will allow the maximum number of fellow EV drivers to park in the location.

I don’t know what we should call this sort of EV violation.  It’s not ICEing the spot, since the car IS an EV (yes, even Plug-ins with Range Extenders (gas engine backups are such), however, the person needs to be more mindful of what they’re doing.

Another example can be seen at the Americana at Brand on Thursday, July 12.  The same day that the BMW X5 above was ticketed for ICEing the spot.

Americana at Brand - Level 2A - Volt using wrong charger 1

This Volt was charging while parked in Spot 2 using the charger on Spot 1. I understand that their charging port is on the driver’s side, but if the other spots had been taken, another car MAY not have been able to park in Spot 1 to use the charger in Spot 2 without possibly crossing Spot 2. The driver of the Volt should have used the charger assigned to Spot 2 and left the charger in Spot 1 available for someone else to use.

Americana at Brand - Level 2A - Volt using wrong charger 2

The charger was available AND long enough to reach the Volt’s front Driver’s side charging port.

Americana at Brand - Level 2A - Volt using wrong charger 3

I don’t know if we have a word for this fellow EV driver erroneously using the wrong charger, but if all indications are correct and there will be more of us on the road, we really need to be more mindful of what EVSEs are appropriate for whatever parking spot we decided to take.

Currently, there are still not that many of us on the road sharing these public stations, but there are definitely more EV drivers than in the past.  And the projected sales figures show a little over 3x as many this year as last year.  So, the EV community needs to be more mindful of how to approach this inadvertent blocking of the precious few charging spots and locations to charge.

Just a few more pics from Lot 6… Finally got a charge…


Didn’t get a chance to post much (or drive much) this week as I’ve been on a business trip to Chicago…

Here are some pictures we took before the trip.  My sister and her family were over and my brother-in-law, who is a car guy, was daring enough to take apart parts of the car to take a look… mainly the plastic cover thing, so I snapped some pics of the “engine” area of the ActiveE.

IMG_1243

IMG_1246

IMG_1247

IMG_1248

IMG_1249

Additionally, it did provide me with the opportunity to get some updated pictures from my better half.  She had her first day with the ActiveE and was a trooper.

She found LAX Lot 6 and was able to get us plugged in for the recharge for the drive back home.

IMG_1165

and to verify that it was plugged in fine. She did a video of the blue blinking light of happiness!

Lastly, ’cause she thought it looked cool and teased me (I hope) with what she tells me she wants for her next car.

IMG_1164

Yes, a Fisker Karma, what can I say, the better half has great taste!

Update to back of napkin math using first month’s SCE Time of Use Tariff


It’s time for an update.  As a response to my $0.31 per kWh price for charging my ActiveE on Southern California Edison’s Domestic Tariff, I signed up for Electric Time Of Use (TOU). Now there are TWO flavors of the TOU tariff.  One requires a separate meter, the other does not.  The approximate cost for the separate meter and installation at my house was an additional $2,000 to $4,000.  Since, we were not sure if we would be staying on Electric after the two year closed-end lease of the ActiveE, we decided to go with the one offered for customers with a single electric meter.  At this point, barring the lack of good choices after the 2 years, we probably will go ahead and get at least a replacement electric vehicle.

So what did we find out after the first month on the new tariff.  First, let me spell out what assumptions were made to calculate the amount of energy used by the AE.  I could have gotten more detailed (counting ALL the emailed kWh usage identified by my Chargepoint EVSE, but decided that I did not really want to do all the calculations and since most of my charging is done at the super-off peak hours and very few outside of these times, that I would overstate the amount of energy and calculate based on the total super-off peak usage AND 10% of off-peak charging to come up with my model.) but I would’ve run out of room on the back of the napkin.  Bottom line, in the new month, I came up with $0.12024 per kWh to charge this past month under the winter rates.  This assumption puts me at the cost to fill up at home at $1.20 per day

So, using the 70 mile number – from my electric cost per mile last month is approximately $0.01714 per mile.  After two months of driving, I have noticed that my average roundtrip is actually a little higher than the 70 mile number.  Let’s call it 85 miles…  So, using this mileage, I was able to recalculate this cost down to $0.01412 per mile.

Using the revised mileage numbers, 407 miles is $5.75 vs. $60.00 approximately 1/12th the cost of ICE.

Folks with lower kWh pricing obviously come out a lot more.  In fact, it’s practically free for those that are on solar power, though not really free, since installing solar DOES cost money.  Now that BMW got a nice group discount at 35%, but still not “free.”

Of course the subsidized power may disappear as electric cars gain greater traction, but there’s a lot of room to go before it gets close to the same level as an ICE car of a similar caliber.  Additionally, it would seem that my rates are bound to go up when Summer Rates kick in, so I will have another update when those bills come in.

Second napkin math for those that use an SUV…


In the vein of my earlier post comparing our ActiveE with our 328i.  Since it was time to fill up our 2001 X5 I figured it would be the time to compare the math vs. the math previously computed for the ActiveE.

Here’s the back of the napkin math. The fill up was for super unleaded at $4.239 per gallon (price of gas is dropping from the time I did the 328i comparison) and I filled up with 20.070 gallons for a total of $85.08. The range says 430 miles, since I zero out the odometer after each fill up, I know I did 358.4 miles since the last fill up. This is about 10 gallons of gas more than the last fill up (9.761 gallons previously).

So, I figure that my cost per mile (using Super Unleaded) is approx $0.2374 per mile.

As with the original calculations on the ActiveE, I’m heavily subsidized… I fill up at many locations where the electricity AND parking is free, the only place it costs to fill up is at home. I do about 35 miles each way to/from work and I charge for free 3/4 of a mile from the office, assuming 10 kWh of energy at home that I fill up and pay for on the average (some fill ups more, some less) to get me to full. I have yet to pay my Time of Use Tariff, so I’m defaulting to last month’s Domestic Tariff for Electricity, which tops off at $0.31 per kWh, so that’s $3.10 per day of fill up, 10kWh is about 1 day in 70 miles roundtrip…

So my electric cost per mile last month is approximately $0.0443 per mile.

So, 430 miles would run $21.71 vs. $102.07 on the X5… or 1/5th the cost of energy for the X5.  However, the X5 can fit a LOT of stuff vs. the ActiveE, so, it really is not a fair comparison.  Additionally, I use the two cars quite differently from the other.  However, I’ve found that shopping trips to Costco on the ActiveE is A LOT CHEAPER than with the X5 as it lowers the likelihood of impulse purchases of larger (both size and ticket) items.

Side note, Still waiting on the Time of Use bill, so I’ll update later when that comes up. But as I noted previously, I’m guessing that this new tariff drops my cost per kWh to between $0.10 to $0.16 per kWh (depending on Tier 1 or Tier 2 of usage). So, the next month’s cost will probably be closer to $0.0222 per mile.

Back of the napkin math of last night’s fill-up of 328i vs. cost of ActiveE


After having read yesterday’s post.

One of my cousins asked me how much it would cost to fill up the new car and go 407 miles… (of course going this far would require at LEAST 4-5 charges of the car since the range is 100 miles…  Though, as aggresively as I drive, I’m closer to 80 miles)

Here’s the back of the napkin math. The fill up yesterday was super unleaded at $4.279 per gallon, filled up with 14.022 gallons for a total of $60.00. The range says 407 miles, since I zero out the odometer after each fill up, I know I did 322.6 miles since the last fill up. This is about 1 gallon of gas more than the last fill up (13.077 gallons previously).

So, I figure that my cost per mile (using Super Unleaded) is approx $0.1860 per mile.

On the ActiveE, I’m heavily subsidized… I fill up at many locations where the electricity AND parking is free, the only place it costs to fill up is at home. I do about 35 miles each way to/from work and I charge for free 3/4 of a mile from the office, assuming 10 kWh of energy at home that I fill up and pay for on the average (some fill ups more, some less) to get me to full. Last month I was on the Domestic Tariff for Electricity, which tops off at $0.31 per kWh, so that’s $3.10 per day of fill up, 10kWh is about 1 day in 70 miles roundtrip…

So my electric cost per mile last month is approximately $0.0443 per mile.

So, 407 miles would run $18.03 vs. $60.00 on the 328i… or 1/3rd the cost of a smaller recent 3 series BMW… Numbers look even better versus an X5, but that’s just ridiculous.

The other question he emailed me was to compare it versus a Hybrid. Luckily, I have one of those too. (again, not an environmentalist, it gave me MANY years of carpool access until the privilege was repealed July 1, 2011).  My cost per gallon on my civic right now is $4.109 (educated guess, (not sure what it is right now, haven’t filled up the hybrid since I went electric)) per gallon, 407 miles would probably be 10 gallons (doing average 40-41 mpg), so at $4.109 per gallon That’s $41.09 for 10 gallons and for  407 miles,  that’s $0.1009 per mile, when gas prices go down, the difference between hybrid and electric gets lower and the convenience of gas stations really kicks the butt of having to find EVSE charging stations..

Side note (updated 5/11/12), I have migrated to a Time of Use tariff that drops my cost per kWh to between $0.10 to $0.16 per kWh (depending on Tier 1 or Tier 2 of usage). So, this month’s cost is $0.01412 per mile.